Read your 360 Reports
See how a team or the whole org scored: coverage, distribution and the reviewer breakdown.
4 min read
360 Reports turn a cycle's results into line analytics for managers and skip-level leaders. Pick a cycle to see coverage, the average final score, and how ratings break down.
Steps
- 1
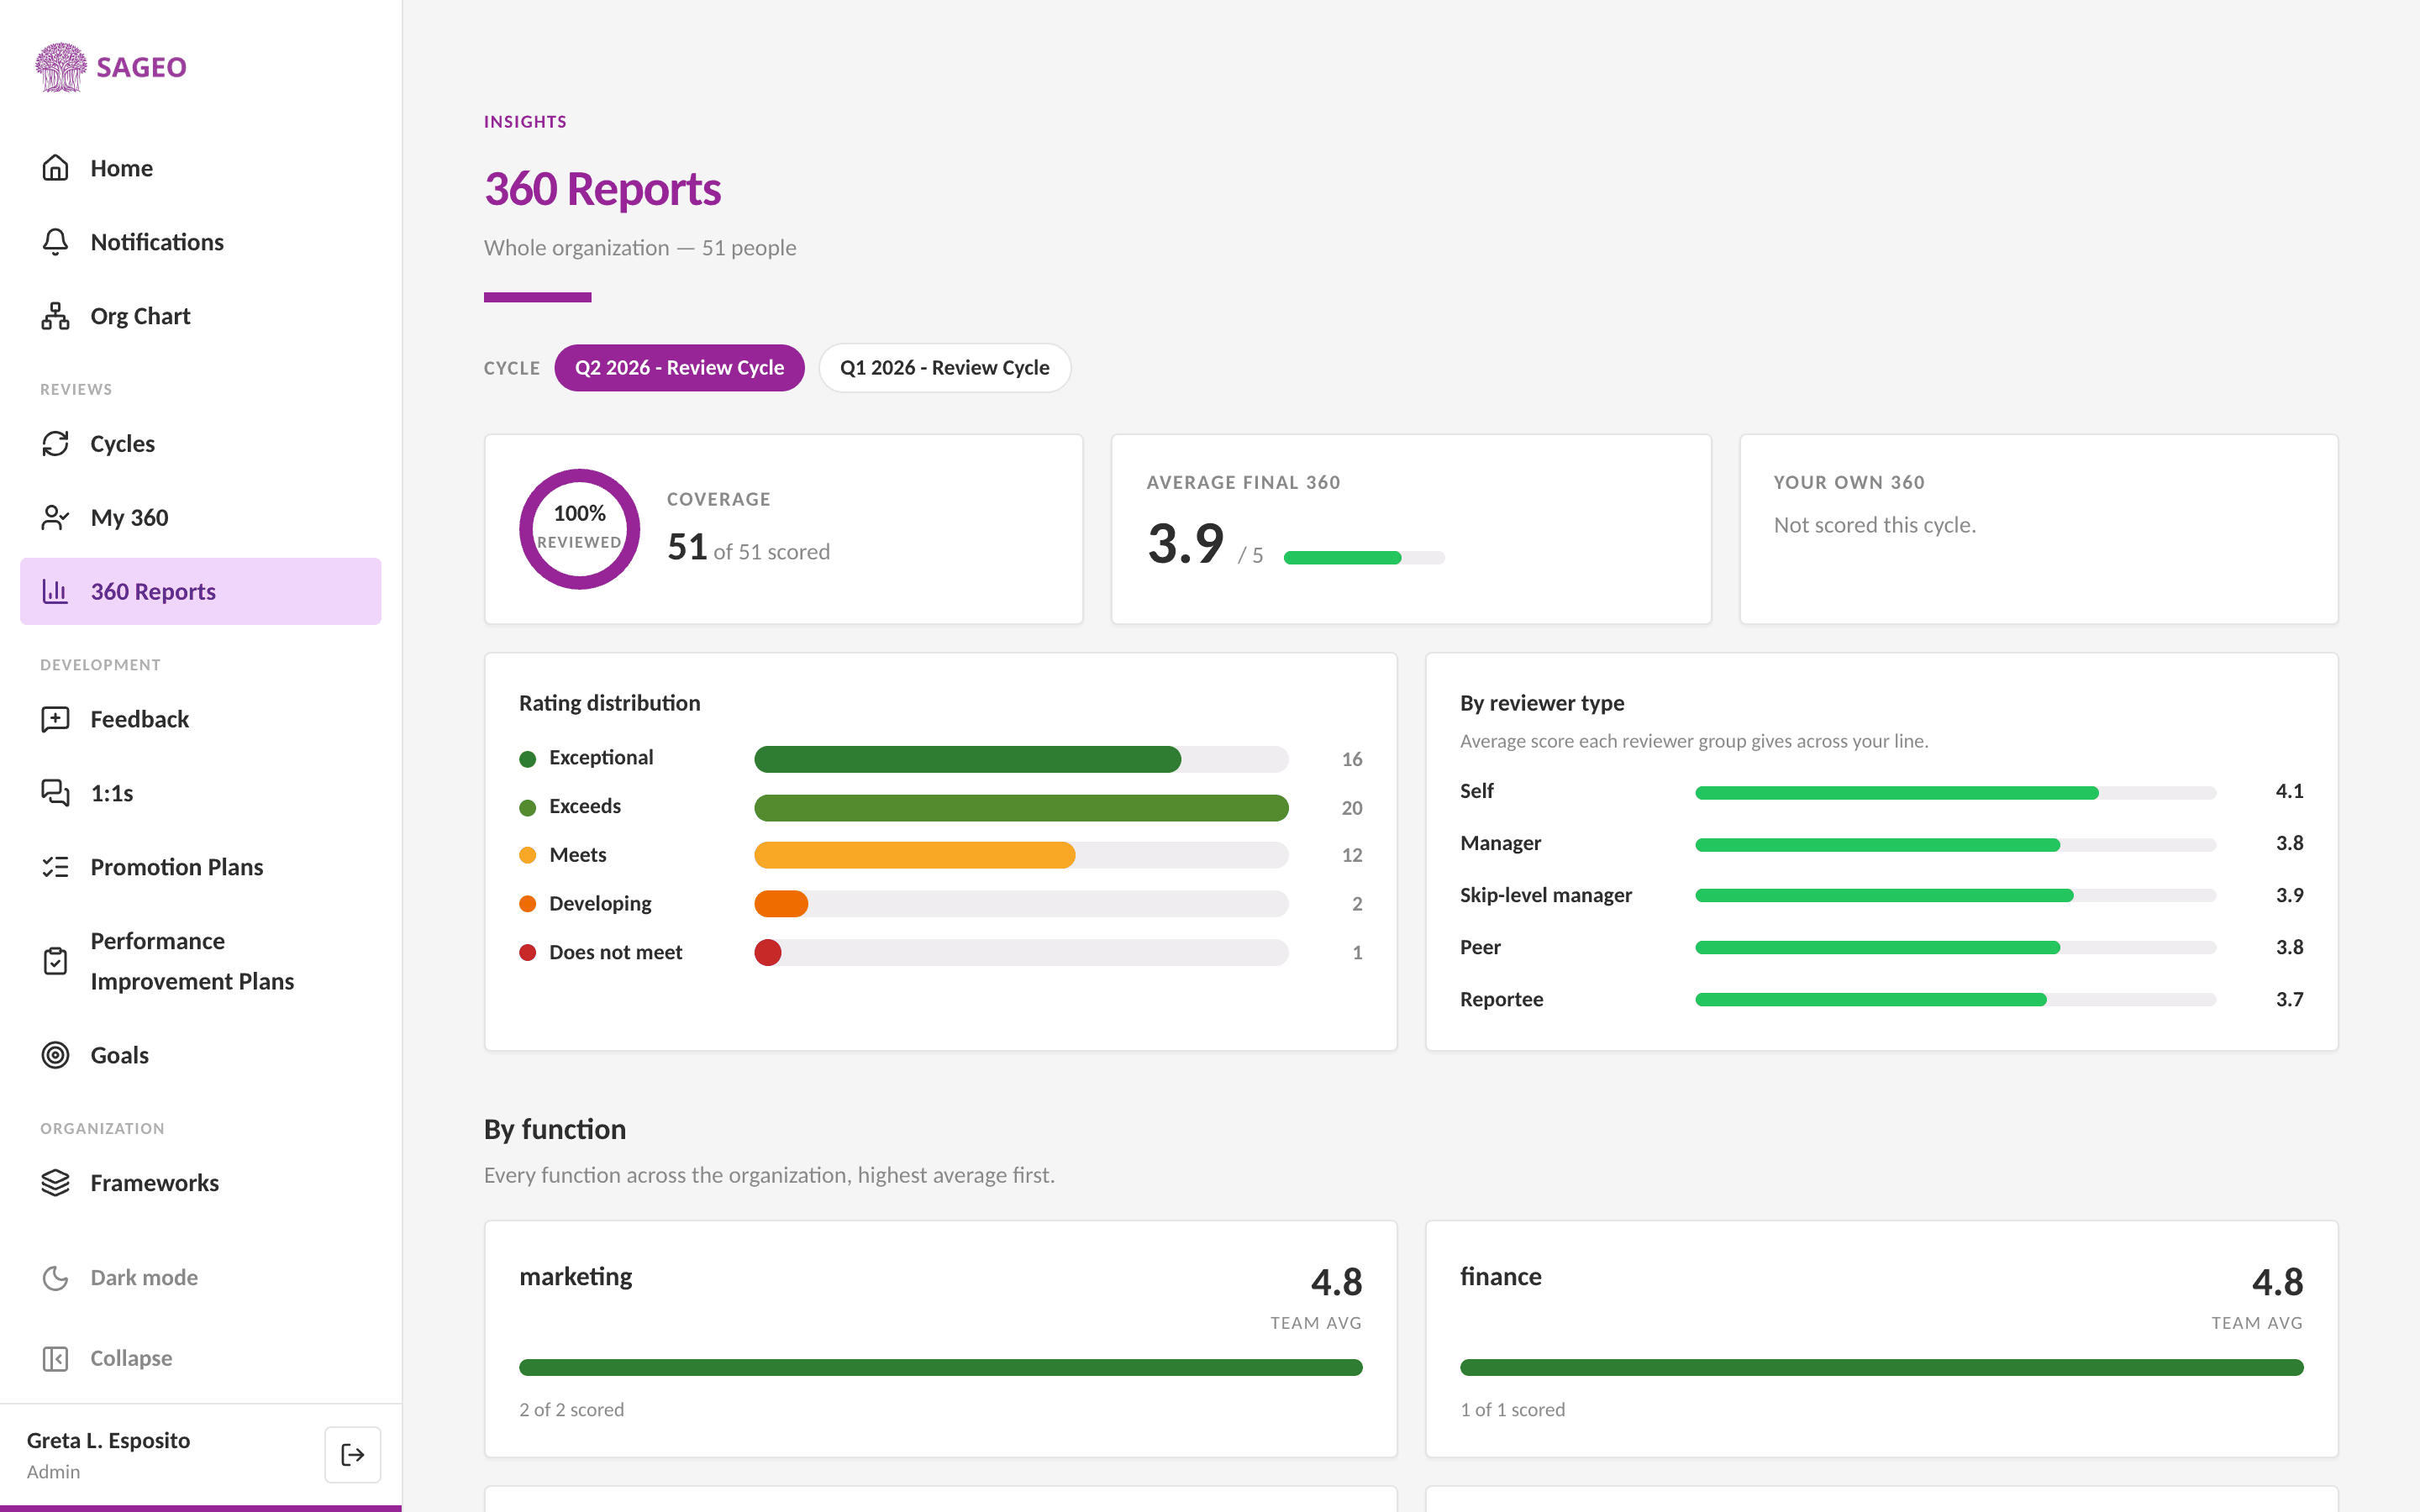
Open 360 Reports from the sidebar and choose a cycle.
- 2
Read the headline numbers: coverage (how many people were scored) and the average final 360.
- 3
Use the rating distribution and the By reviewer type breakdown to see how self, manager, skip-level, peer and reportee scored across your line.
- 4
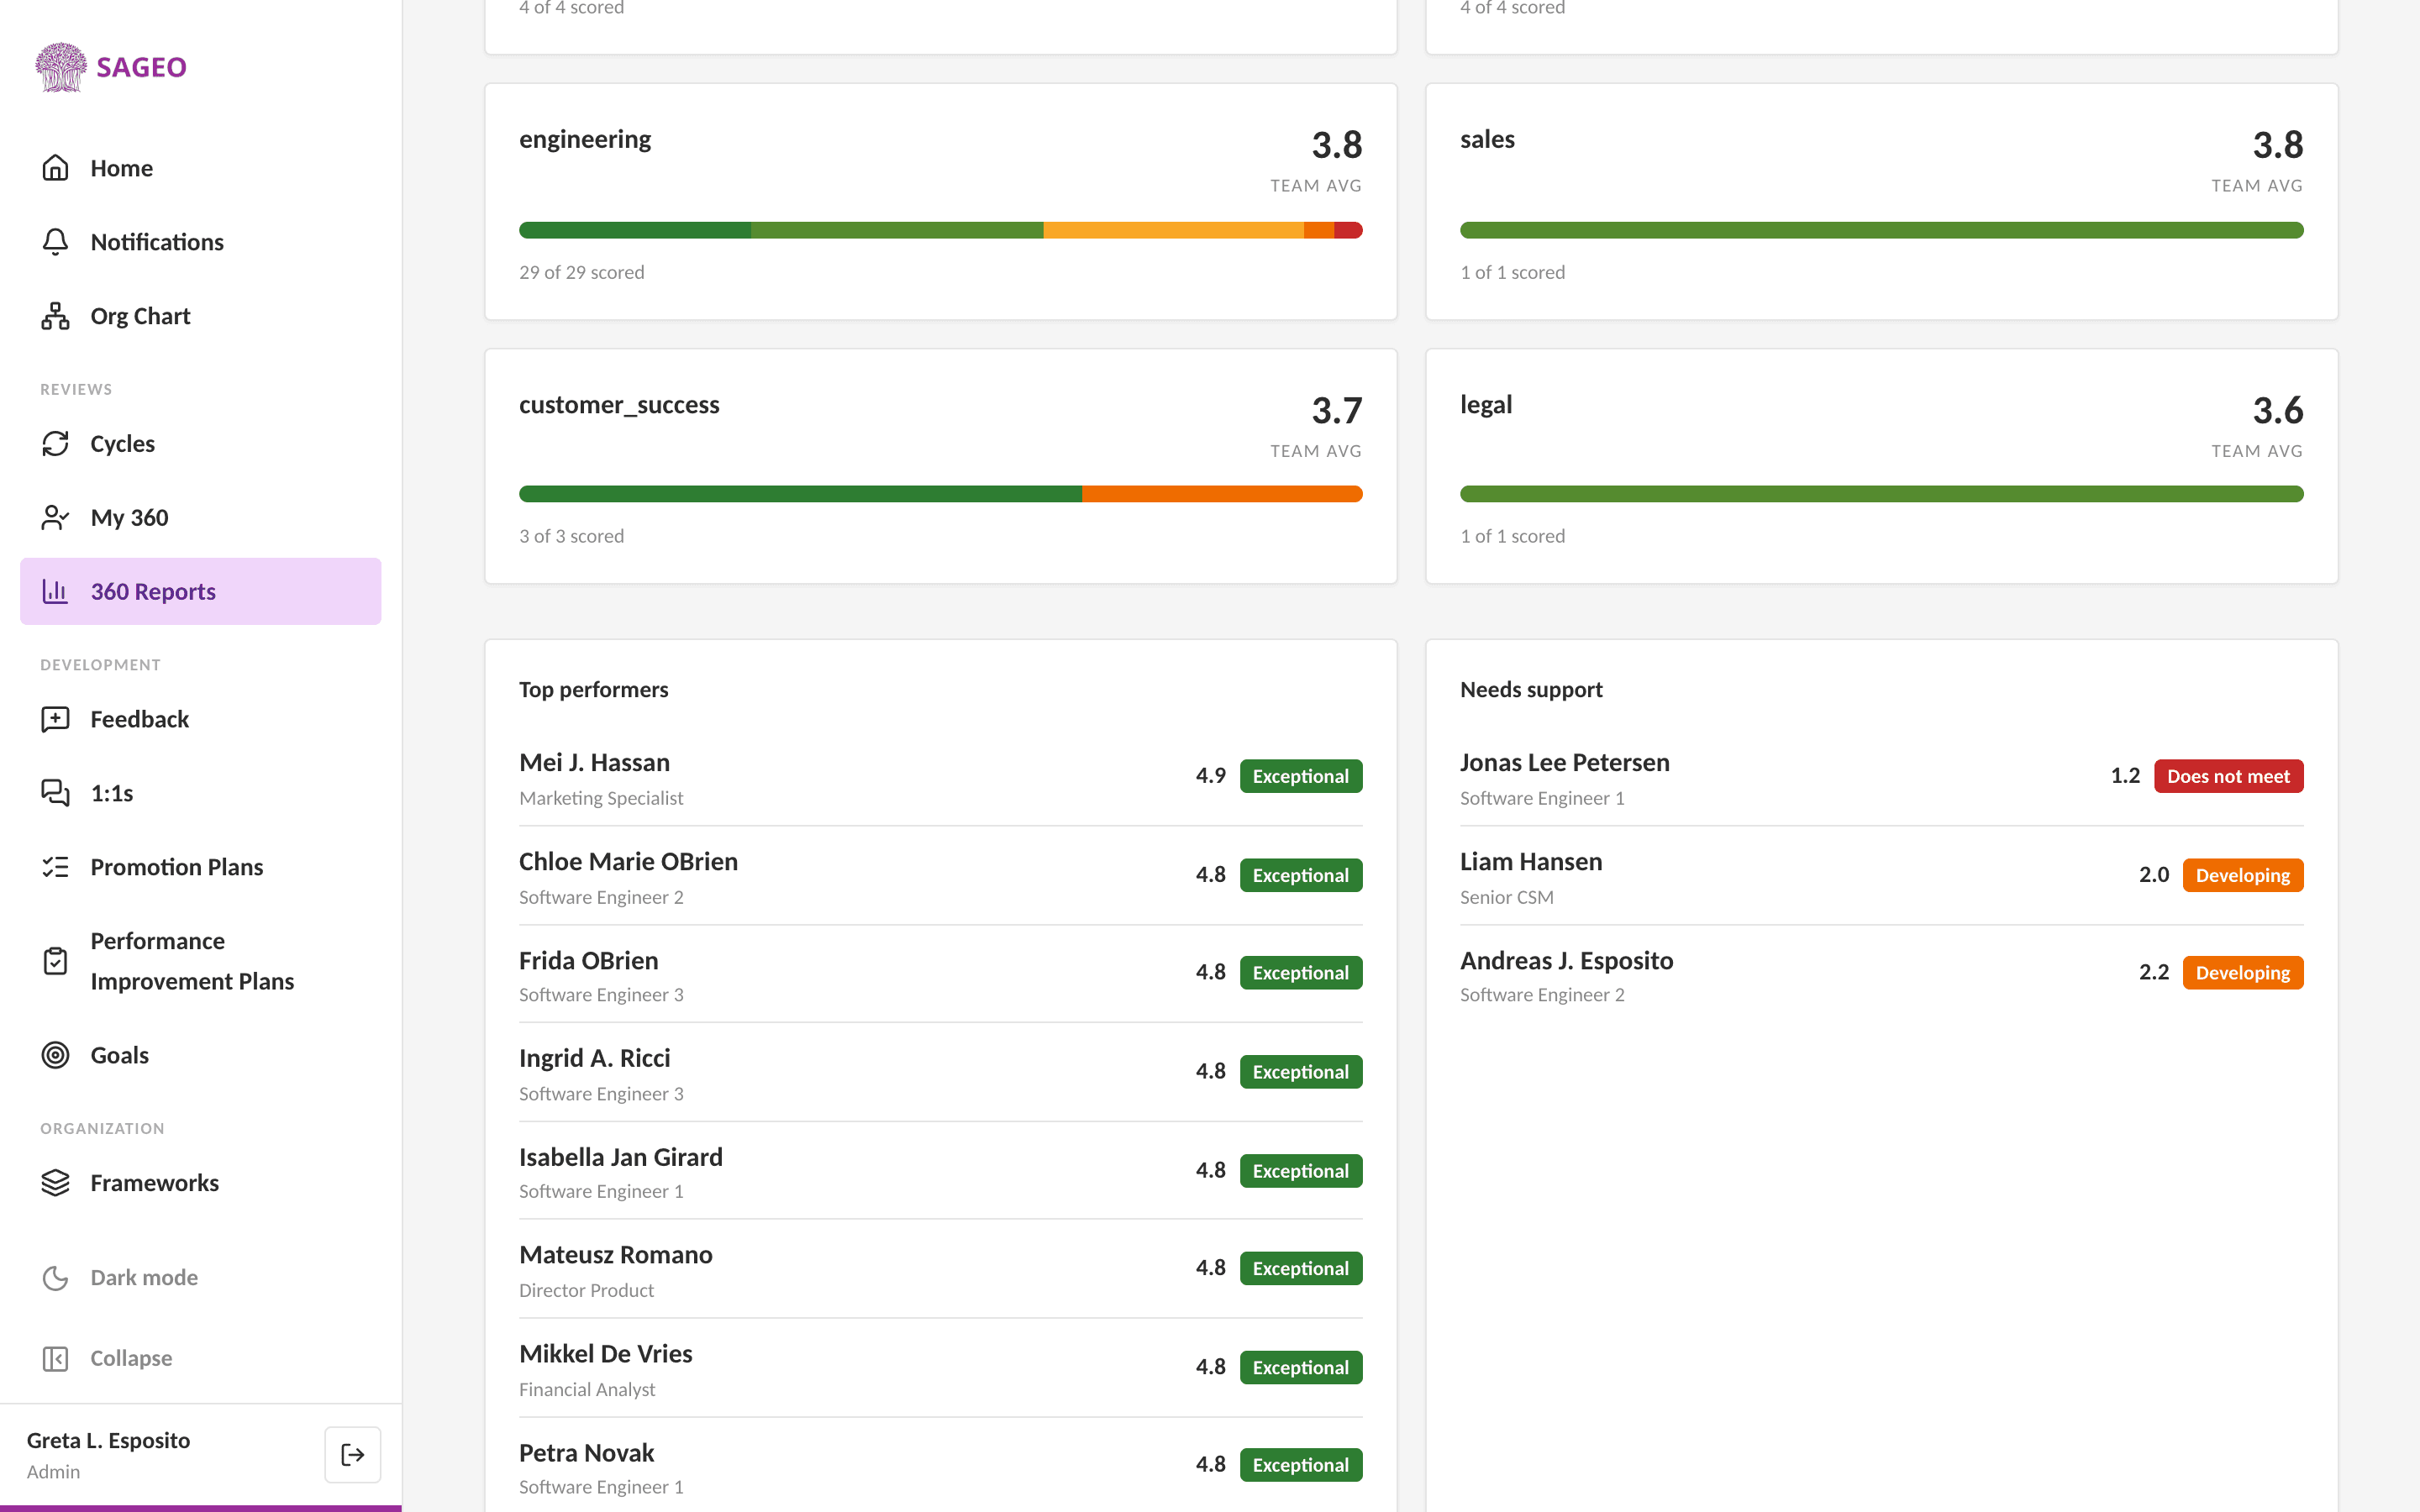
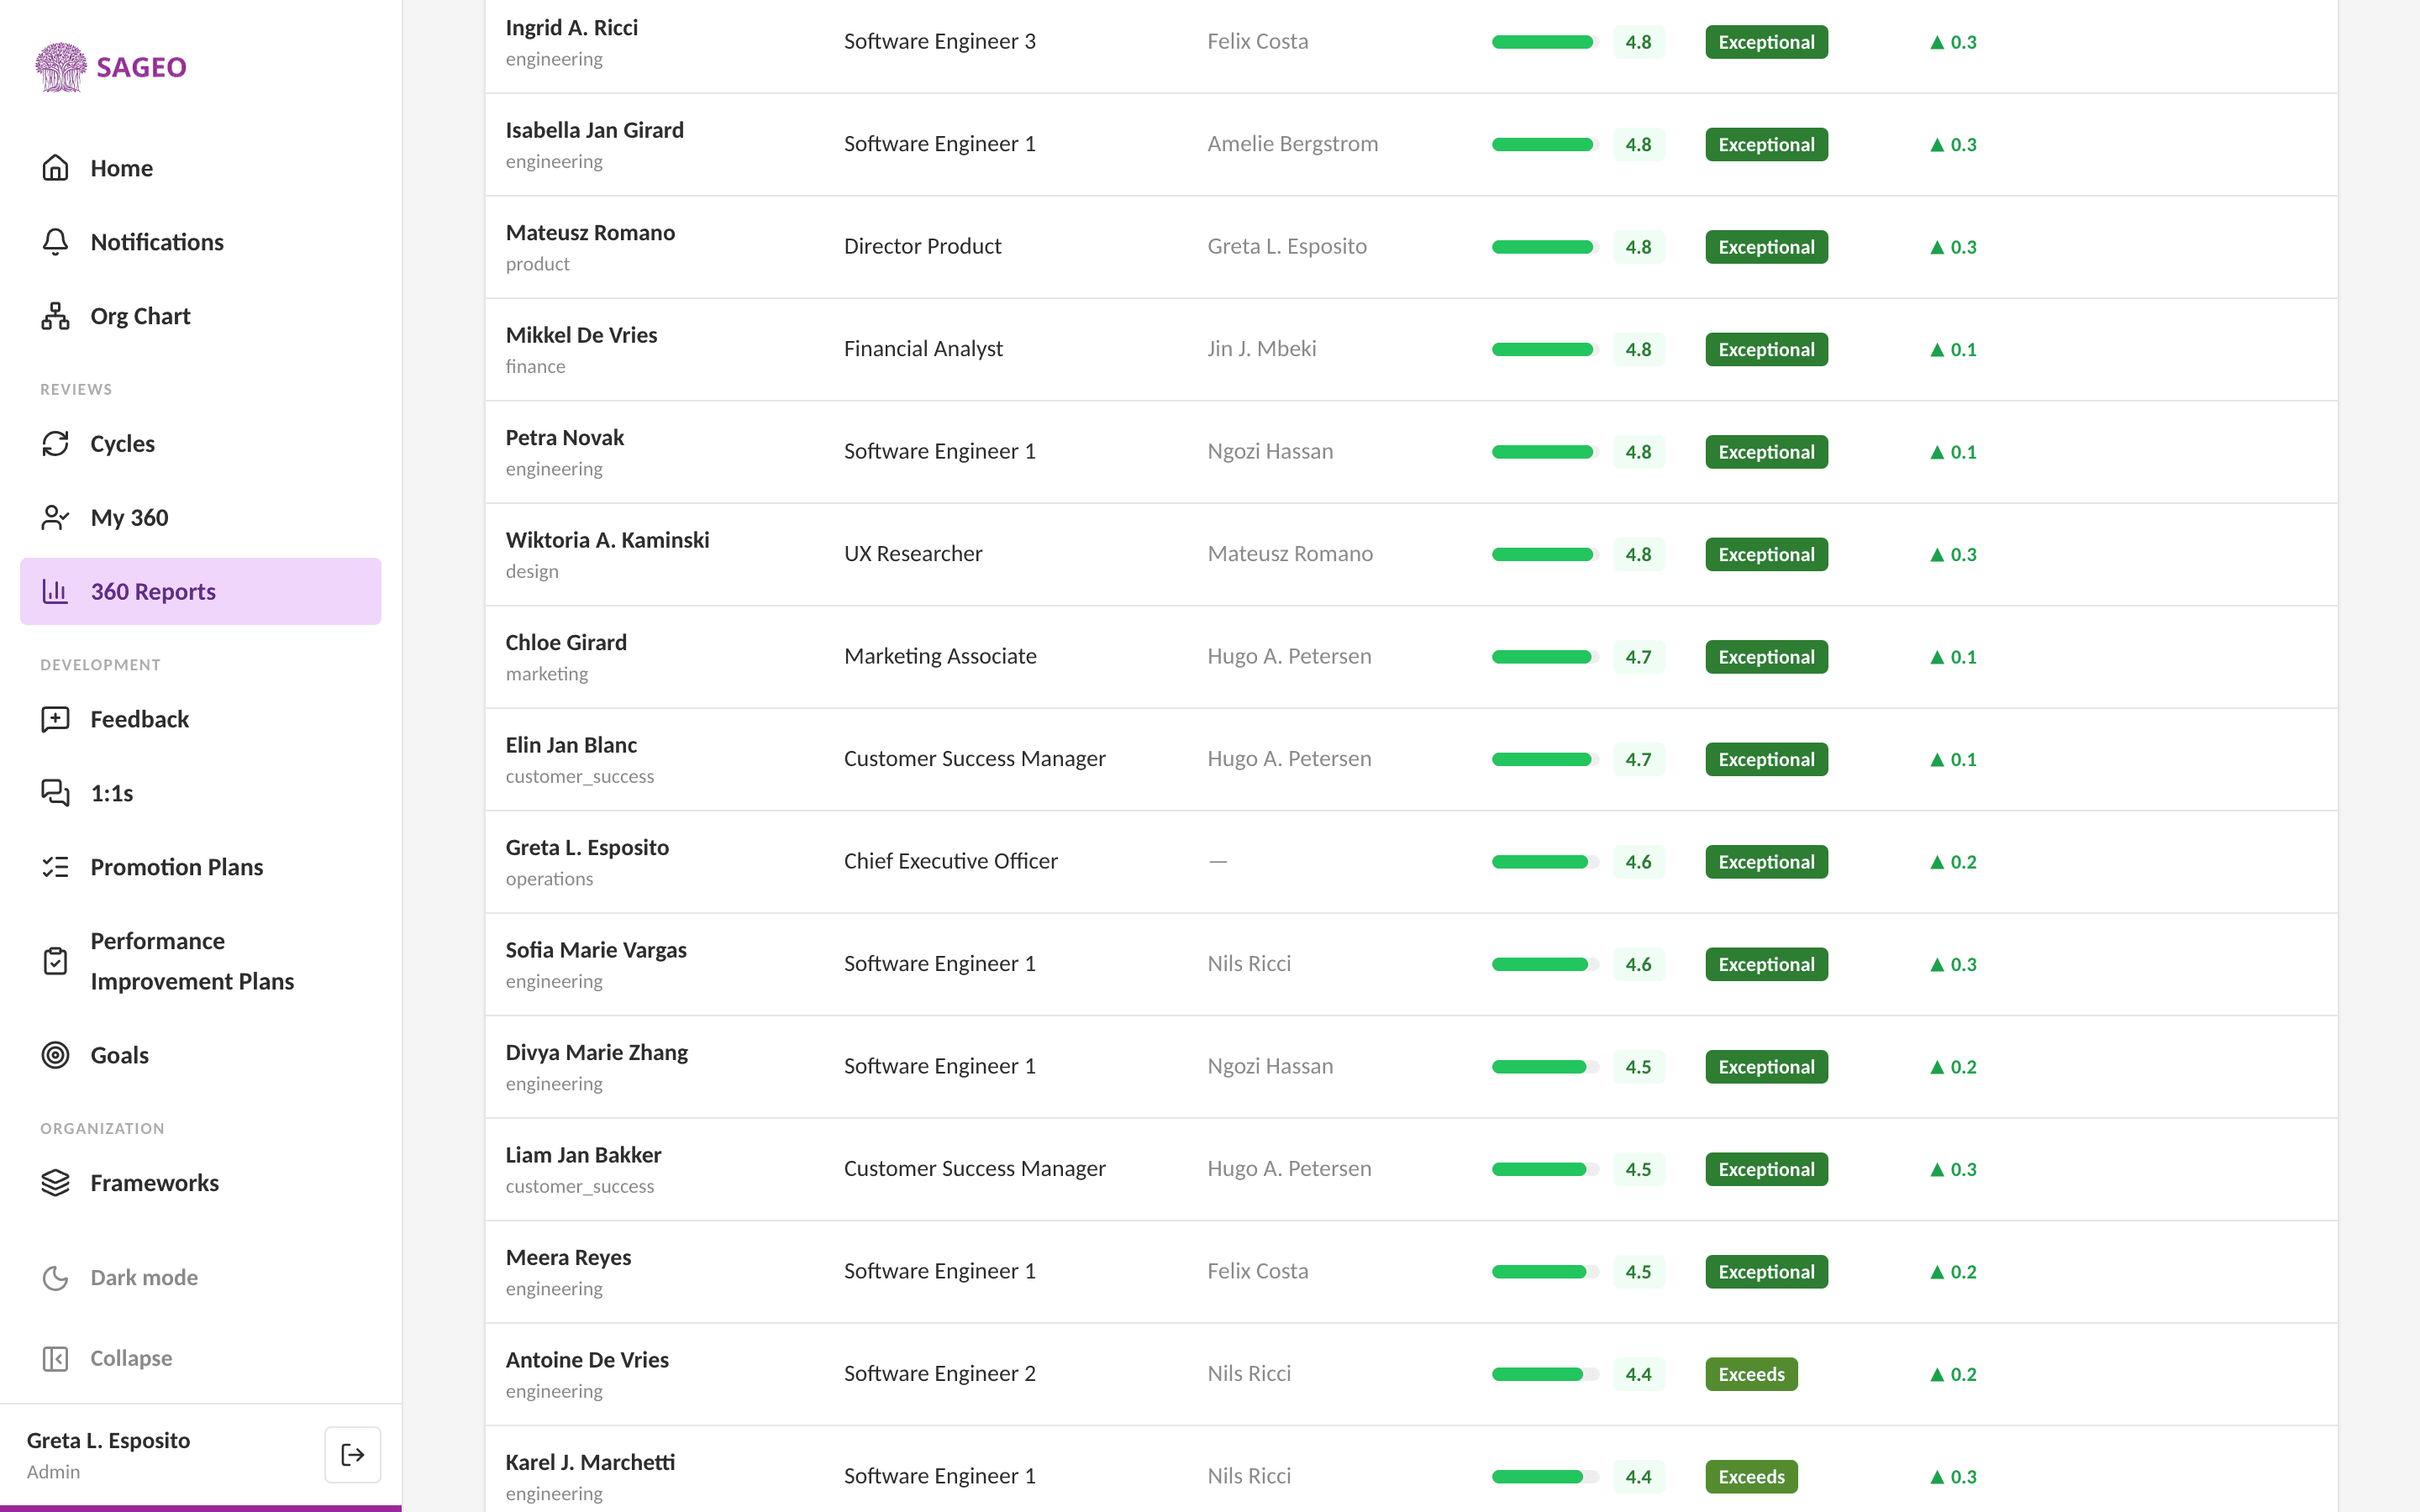
Scan By function to compare teams, and open the roster to see individuals.
Good to know
Your view is scoped to your line. Admins see the whole organization; managers and skip-level leaders see their downline.
Still stuck? Email hello@sageo.ai and a person will help.